
In this article
Tomorrow’s weather app says 18 degrees. That is a clear number, but not a complete answer. Is an afternoon outside easy to plan? When might it rain? And how much confidence should you place in the temperature itself?
With Mostly, we work on this gap between a forecast and a decision. The aim is a clear overview of current conditions, the coming hours and days, rain and available warnings. Making uncertainty visible belongs in that overview.
A forecast is a calculation
Weather models represent the atmosphere computationally. Ensemble forecasts consider multiple model runs with changed initial conditions. Closely grouped runs tell a different story from widely diverging outcomes. The Open-Meteo ensemble documentation offers a technical introduction to this data.
For everyday use, communicating the results matters more than displaying the number of calculations. A single temperature provides orientation. It does not automatically reveal the other paths represented in the model runs.
What the forecast band shows
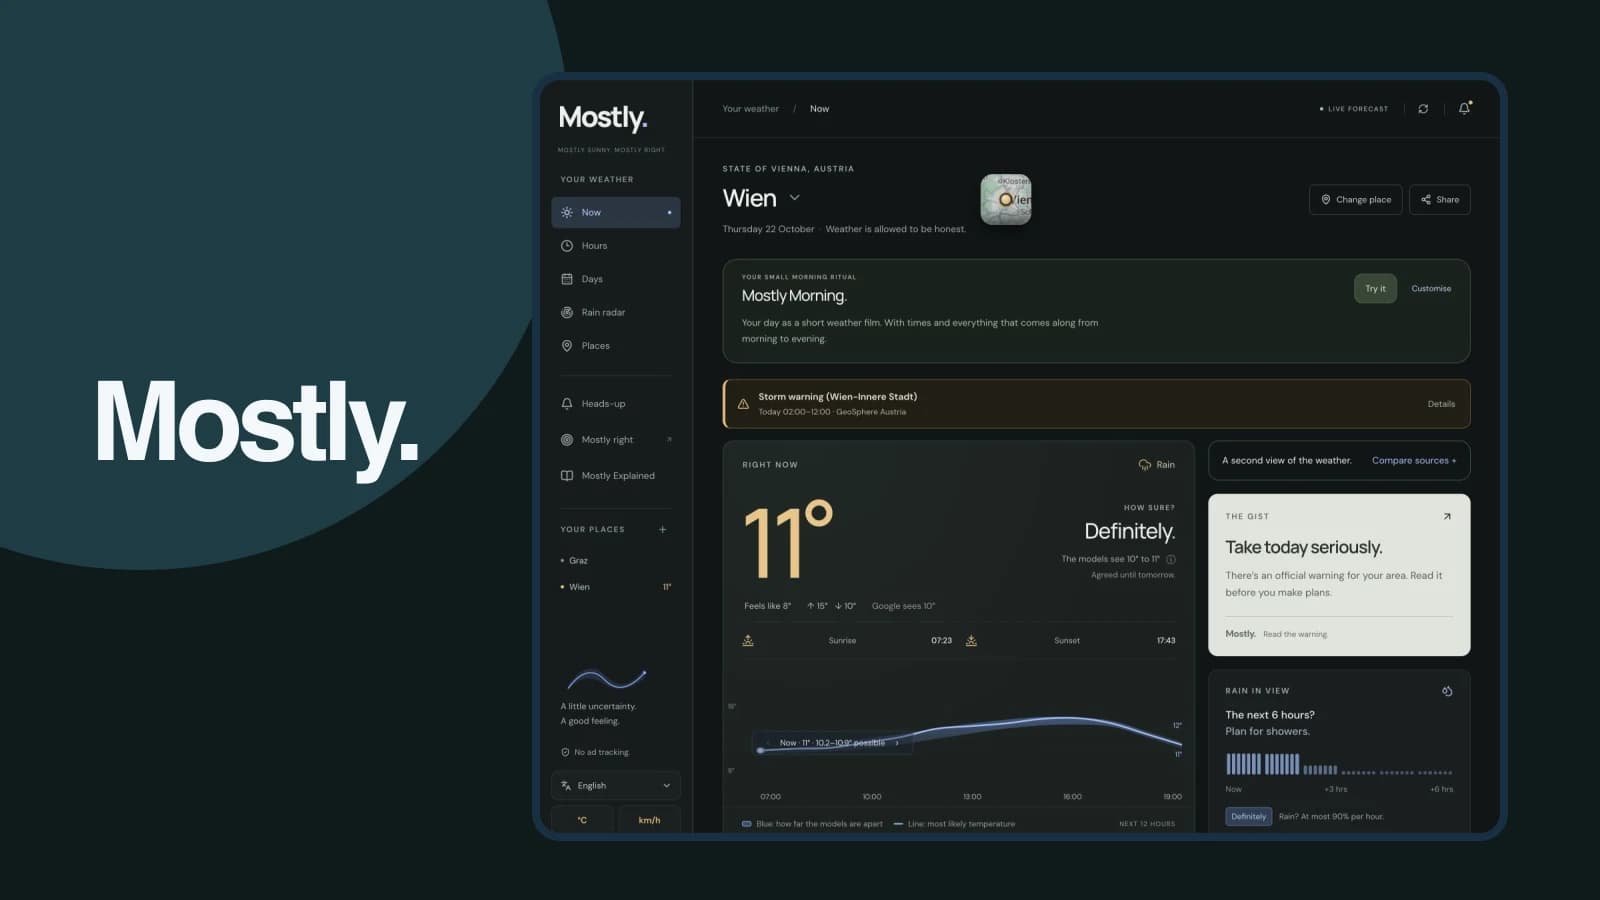
Mostly displays a coloured band alongside its temperature curve. This makes the range of possible temperature paths visible. A narrower band represents more closely grouped outcomes; a wider one reveals larger differences.
Temperature and rain remain separate questions. A narrow temperature band does not, by itself, mean an outing will stay dry. That is why we bring several kinds of weather information together instead of expecting one visualisation to answer everything.
The range is also not a promise that the actual temperature will remain inside it. It describes the calculations shown. Weather can develop differently, and new data can change the next forecast.
From a weather value to a daily plan
Start with the question you need answered. Planning a commute needs a different time horizon from organising a weekend outing.
| Your question | Useful view in Mostly |
|---|---|
| What should I expect when leaving? | Current conditions and the next hours |
| Should I prepare for showers? | Rain outlook and radar |
| How stable does the temperature forecast look? | Temperature curve and forecast band |
| Is there a relevant warning? | Warning with place, time window and source |
| What about my destination? | Saved places and their forecasts |
Suppose you want to walk in the afternoon. Check those hours first, then the rain outlook. If a warning appears, read its details. The temperature band adds another perspective rather than replacing those steps.
Radar and forecasts complement each other
A spatial rain view helps you examine the area around the selected place. An hourly forecast describes a development over time. They answer different questions and should not be treated as interchangeable.
Also check the place and time to which information refers. A forecast for home does not automatically answer the question about your destination. Mostly lets you save several places and switch between them.
Give warnings their own attention
When an official warning is available, its specific information matters: affected region, time window, event and guidance from the issuing authority. A small weather icon cannot replace these details.
The product image on our website shows loaded Vienna data captured on 22 October 2026. It documents the interface and is not a live forecast for your visit. Find current values and available warnings directly in Mostly.
What the design teaches us
Additional information helps only when its meaning remains clear. A weather interface needs a useful order: orientation first, detail next, and then the option to inspect sources or another location.
The same principle applies beyond weather. A dashboard should help people understand which question a value can answer. Connecting data with everyday decisions is part of our product development work.
Frequently asked questions
Does a wide band mean a bad forecast?
It first shows that the represented outcomes differ more widely. For planning, making that uncertainty visible is more useful than suggesting unsupported precision.
Why do weather services show different values?
Their sources, models, update times and location mapping can differ. Compare the time and source as well as the number.
Where can I try Mostly?
In the browser at mostlyweather.com and through the store links on our Mostly product page, which also explains radar, saved places and other weather details.